Website Maintenance
The Schuylkill Action Network website will be down for maintenance Tuesday December 3rd from 3:00pm to 10:00pm EST
News
"So many important decisions about water happen at the local level: Where to invest in green infrastructure or water efficiency? How to reduce sewer overflows to local creeks? What are the best strategies to eliminate water shut offs? Because water utilities are key players in those decisions, creating and maintaining trust between water utilities and community organizations is critical for successful decision making and investing that leads to safe, clean and sustainable water for all."
Data visualization is an important tool for communicating science to a broader audience. Whether you are a volunteer community scientist or a professional aquatic ecologist, there are many free tools and low-cost programs that you can use to link the scientific data to actions that can improve water quality. We will walk you through the process with some tips and tricks on how to communicate your results most effectively.
Pages
About Us
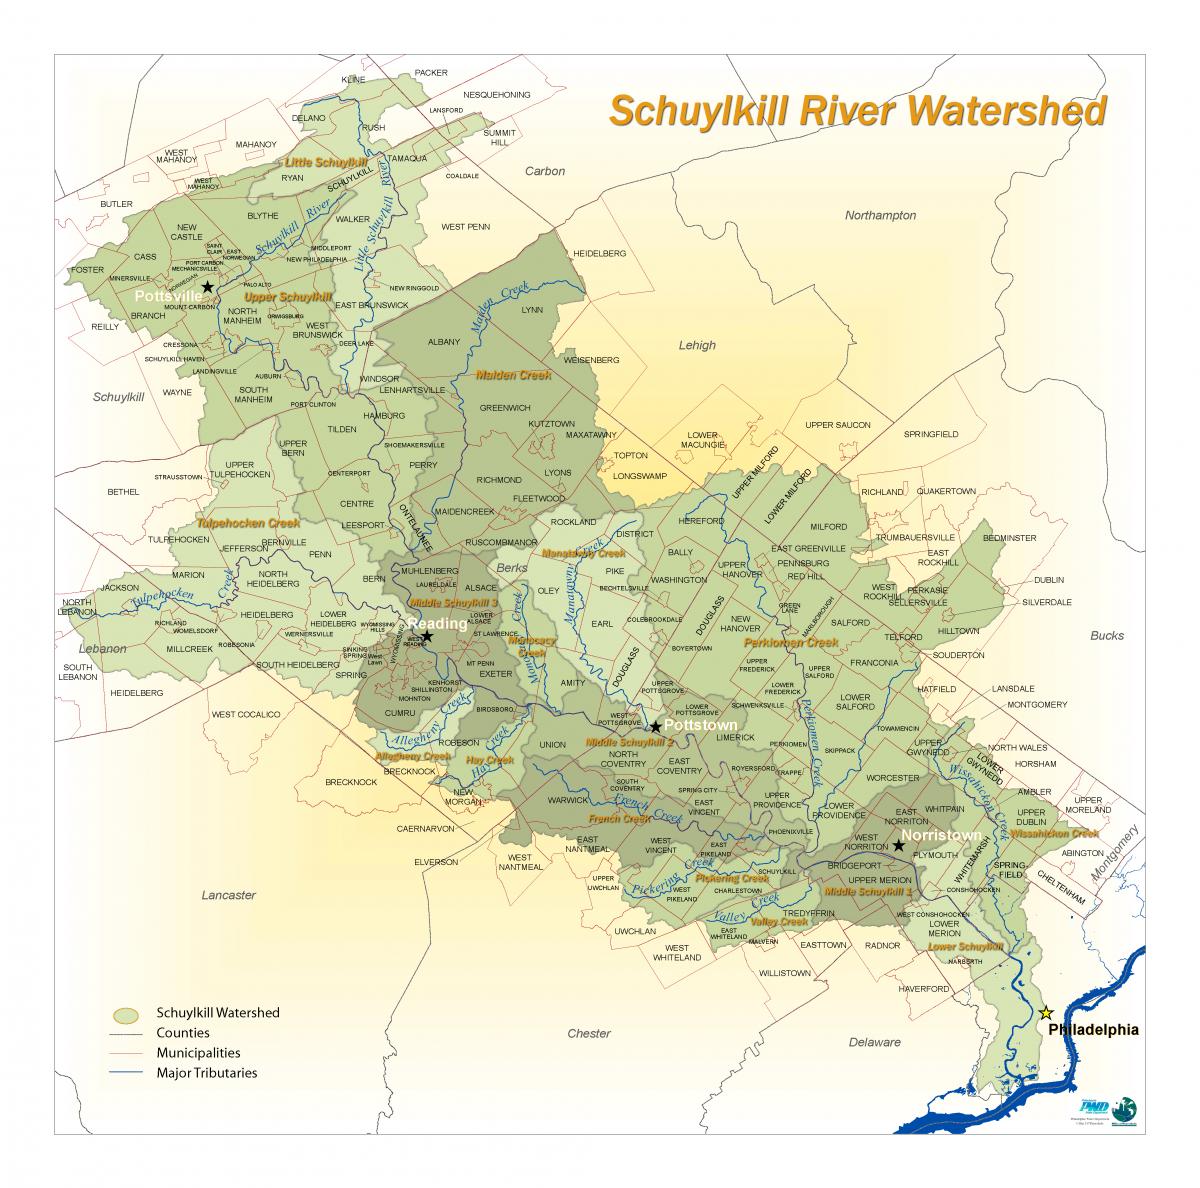
The Schuylkill Action Network (SAN) is a collaborative network of over 300 partner organizations working together to improve water resources in the Schuylkill River watershed. With "action" as SAN’s middle name, SAN partners have been working since 2003 to implement best practices across the Schuylkill River Watershed.
Downloadable Map